We have built a fabulous wealth of statistical tools in Ontario to help us to manage the operations, plan strategically, and justify our value with measurements, statistics and impacts. The team of FOPL, OLA, SOLS, OLS-North and CULC listened to your voices in Libraries 2020 and Libraries 2025 and have created or assembled a made in Ontario approach to Measurements for Public Libraries. We built easy-to-use tools for all sizes of libraries, accessed best practices from around the world, held symposia, and created sustainable training opportunities.
We have so many tools now – good on us! – but it can be confusing to decide which tool to use and when! So, this blog posting attempts to provide our members with:
- A summary of each tool
- Links to each of the tools
- How each tool can have a positive impact on your operations
- Which tools deliver the return on effort in which context
- A visual that helps you to understand the relationships of our tools (in development)
A major trend in our funders – governments (municipal, provincial, and federal) and foundations – is to ask for greater return on investment reporting, more accountability reporting, and measurements of outcomes and impacts. We are well prepared in Ontario to address these demands and we have the talent pool and toolkits to share and do so.
What are all of these Library Statistics Tools in Ontario and what can I do with them?
Each tool covers a specific measurement task. All of the tools may not be right for your system’s resources and needs. However, it’s wise to be aware of all of the tools. Some rank Ontario’s libraries, some deliver templates to measure social or economic return on investment, some measure specific portfolio services and some provide tools to measure the impact of specific programs. All are wonderful in their own context.
The BIG List of the Resources Available:
- Ontario Ministry of Tourism, Culture & Sport Public Library Data Collection (A series of annual, open data reports from 1999-2017)
- Federation of Ontario Public Libraries longitudinal analysis of the Ontario Ministry of Tourism, Culture & Sport Public Library Data Collection.
- Ontario Public Library Statistics: Special Reports Service
- Southern Ontario Library Service PLA Project Outcome
- Nordicity Bridge Toolkit (Toronto Public Library
- Martin Prosperity Institute University of Toronto Rotman School of Business, So Much More: The Economic Impact of Toronto Public Library on the City of Toronto (2013) and others that followed the model
- Toronto Public Library Library Statistics and Value Reports
- CULC Key Performance Indicators
- CULC Social Inclusion Audit and Toolkit
- Nordik Institute / Algoma University (OLS-North) Valuing Northern Libraries Toolkit
- OPLA Teen Services Benchmarking & Statistical Report 2018
- OPLA Children’s Services Benchmarking & Statistical Report 2016
- Market Probe Canada Public Opinion Report on the Attitudes of Ontarians abut Public Libraries 2015
- Counting Opinions
Tell me about each resources and what it does:
Introduction:
You can learn more about each resource by following the links above. They’re easy reads and worth the effort.
While each resource does a lot of things with regard to statistics and measurements, each has their own strength.
The following principles apply:
- All of these tools work for every type and size of public library.
- All of these tools can be scaled in application to your public library system’s needs and staff resources.
- All of these tools can be done through outsourcing to others if you need them faster or don’t have the staff resources.
- You don’t need to collect statistics exhaustively all year long. Some data is easy to find through your systems and some (sometimes the more important data) can be collected through sampling and asking your users.
- You don’t need to be a statistics guru to get value out of these tools.
- Most of these tools have associated training sessions, recording e-learning sessions and communities of practice support.
- Many of these tools have large comparators of similar types of libraries in Ontario, nation-wide and internationally.
- Nearly all of these tools are available at no charge.
What is each tool best for?:
These are the data you provide to the Ministry in annual open data reports from 199-2017. The data is in excel spreadsheets in individual annual files. This is the longest data set on Ontario public libraries and has the benefit of being collected in normalized fields with data definitions. It also has the benefit of being the provincial government’s own data.
You can download these files and manipulate them yourself but we don’t recommend it! The Ministry provides a free service to mine the data for special reports if you ask.
Use when: You need raw statistics.
FOPL has downloaded all data from 1999-2017 and normalized it.
Ontario Public Library Statistics: Special Reports Service
This is a special report service that mines the normalized data harvested by FOPL into a single database. We analyze and report on all of Ontario’s public libraries and rank them as a whole and in their population bands on a set of 13 specific measurements in 5 buckets of service, usage, community engagement, efficiency, and development. It answers the question of where your library ranks in Ontario or in your band. You can gain insights such as:
- Why is our programs ranking low? Maybe we don’t have enough branches or program rooms.
- Why is our community engagement ranking high? Maybe it’s because we have strong partnerships?
- Why is circulation ranked low? Maybe we need to look at our weeding, collection development, collection size, or collection average age, etc.
Use when: You need peer comparisons to a special subset of public library peer comparators for strategic planning purposes.
Southern Ontario Library Service PLA Project Outcome
Project Outcome helps public libraries understand and share the true impact of their services and programs with simple surveys and an easy-to-use process to measure and analyze outcomes. Project Outcome is a free toolkit offering libraries access to training, data analytics, and standardized surveys that measure outcomes in seven key library service areas: Civic/Community Engagement, Digital Learning, Early Childhood Literacy, Economic Development, Education/Lifelong Learning, and Job Skills. You have access to the entire community of Project Outcome in Ontario and North America.
Use when: You’re focusing on a specific program or portfolio of services to evaluate, justify or plan growth.
Nordicity Bridge Toolkit (Toronto Public Library)
Bridge Technology Services Assessment Toolkit (Bridge) enables public libraries to deliver on this vision by:
- Building on the collective capacity of Ontario public libraries to deliver services that are responsive to rapidly changing technology and to the
unique needs of their communities; - Providing evidence of the value and impact of that investment;
- Contributing to a more accurate and complete picture of how technology services fulfill the mandate of public libraries to deliver effective and
efficient services; - Enabling libraries to understand and demonstrate how technology services directly benefit residents of their communities, particularly the
most marginalized and highest need customers, and how these services align with the priorities of government, business and social services.
Use when: You’re focusing on a measuring and justifying the impact of the digital portfolio of public library services to evaluate, justify or plan growth.
This study was conducted by the Martin Prosperity Institute at the University of Toronto in December 2013, and was funded by the Toronto Public Library Foundation. It is a classic public library economic impact study that has been repeated many times by libraries of all sizes.
Use when: You need a simple measurement of the economic impact of your public library system.
Toronto Public Library Library Statistics and Value Reports
TPL has the scale to engage in a number of statistics and measures activities to manage the largest library system in the world. Don’t dismiss their activities because of their scale. There is much to learn here and they are always willing to share.
TPL also participates in MBN Canada as do other Ontario public libraries. The strength of this tool is that it measures municipal services beyond libraries.
Municipal Benchmarking Network Canada
What is this Service?
Libraries are an important resource to meet the changing needs of individuals and communities. They foster literacy, life-long learning and support a love of reading in people of all ages. Libraries also provide support for newcomers and job seekers and build diverse communities. They address the digital divide and help individuals and communities transition to a global, knowledge-based economy.
http://mbncanada.ca/practice/libraries/
CULC Key Performance Indicators
One of the key strategic goals for CULC/CBUC is to become the top quantitative source for quantitative research as it pertains to public libraries on the continent. Strong management sees the value in strong key performance data. CULC/CBUC (and predecessor organizations) has collected library statistics for more than 20 years. CULC/CBUC works in partnership with Counting Opinions (SQUIRE) to provide service to members and subscribers. For more information about becoming a subscriber, please contact CULC/CBUC Executive Director Jefferson Gilbert at 416.699.1938 or jgilbert@culc.ca Current members and subscribers to the CULC/CBUC KPI service can access by CLICKING HERE.
Past reports can be found here.
Use when: You’re choosing KPI’s for your system
CULC Social Inclusion Audit and Toolkit
The Canadian Urban Libraries Council (CULC) / Conseil des Bibliothèques Urbaines du Canada (CBUC) defines social inclusion as the participatory, authentic, and accountable manner in which institutions uphold and reinforce the principles of access, equity and, as a result, social inclusion for all.
Social inclusion is the manner in which institutions understand and engage their communities, as well as how they explore, view, and challenge barriers, values, and behaviours. Social inclusion is also defined by how institutions develop, implement, and evaluate policies and procedures, how they provide equitable access to services, and finally, how they demonstrate the level of inclusion through tangible outcomes.
To this end CULC/CBUC undertook a multi-year research study into social inclusion and the public library. The findings were published in 2010.
Use when: You’re trying to meet the needs of diverse communities or in your HR planning.
Nordik Institute / Algoma University (OLS-North) Valuing Northern Libraries Toolkit
This tool is designed to measure the value of public libraries and their role as community hubs, building capacity for healthy, resilient people and places, especially in rural, Northern, First Nation and francophone communities. The toolkit provides a step-by-step process to assess libraries’ social return on investment (SROI) within a holistic, cross-sectoral framework. The Social Return on Investment (SROI) is a term describing the social impact of a business or non-profit’s operations in dollar terms, relative to the investment required to create that impact and exclusive of its financial return to investors. It is not just for northern Ontario libraries but can work for any library!
The framework identifies seven areas where libraries contribute to building individual, organizational, and community level capacity.
- Cultural Integrity & Regional Identity
- Social Inclusion
- Cognitive & Literacy Development
- Health & Wellness
- Engaged Citizens & Safer Communities
- Entertainment & Enjoyment
- Economic Development
Use for: when you’re a smaller library system and require easy to develop social and economic ROI (return on investment) numbers. This toolkit provides a great SROI Indicator Template (the library value calculation spreadsheet) that shows data such as this:
“Rainy River PL was one of six pilot sites for the Valuing Northern Libraries Toolkit project of OLS-North. Based on the Toolkit indicators, and using our 2017 data, preliminary results for the Social Return on Investment for all programs and services delivered by our library is as follows: 1. Raw Economic Benefit, $882,913.02. 2. Total Economic Benefit, adjusted by the cost differential between Toronto and our region (as calculated by the annual Nutritious Food Basket report of Ontario Public Health Units): $1,196,434.01. 3. Benefit per Resident of our catchment area, $602.43. 4. Benefit per Household in our catchment area, $808.95. 5. Economic Impact of One Library Public Service Hour, $251.59. 6. Total Social Return in Investment, based on local operating funding from our appointing council: 3,474%. We would be glad to share full results.”
Use when: You’re trying to get great, supportable metrics for economic and social ROI of the library in your community.
OPLA Teen Services Benchmarking & Statistical Report 2018
Recently released, this regular survey provides benchmarks for your library to compare teen services with others.
Use for: Measuring teen services engagement.
OPLA Children’s Services Benchmarking & Statistical Report 2016
This regular survey provides benchmarks for your library to compare children’s services with others.
Use for: Measuring kids’ services engagement.
Market Probe Canada Public Opinion Report on the Attitudes of Ontarians abut Public Libraries 2015
Done every five years (2000, 2005, 2010, 2015), FOPL leads a province-wide valid poll on Ontarians attitudes towards public libraries. We epxect to do a new one in 2020.
Use for: province-wide data on engagement of Ontarians (‘The People’) with public libraries.
Counting Opinions is a library consulting firm that runs the PLA and some of the CULC and other provincial data collection, consulting, and reporting). They have wide experience and good tools.
Other tools:
These others are mainly US oriented but worth knowing about:
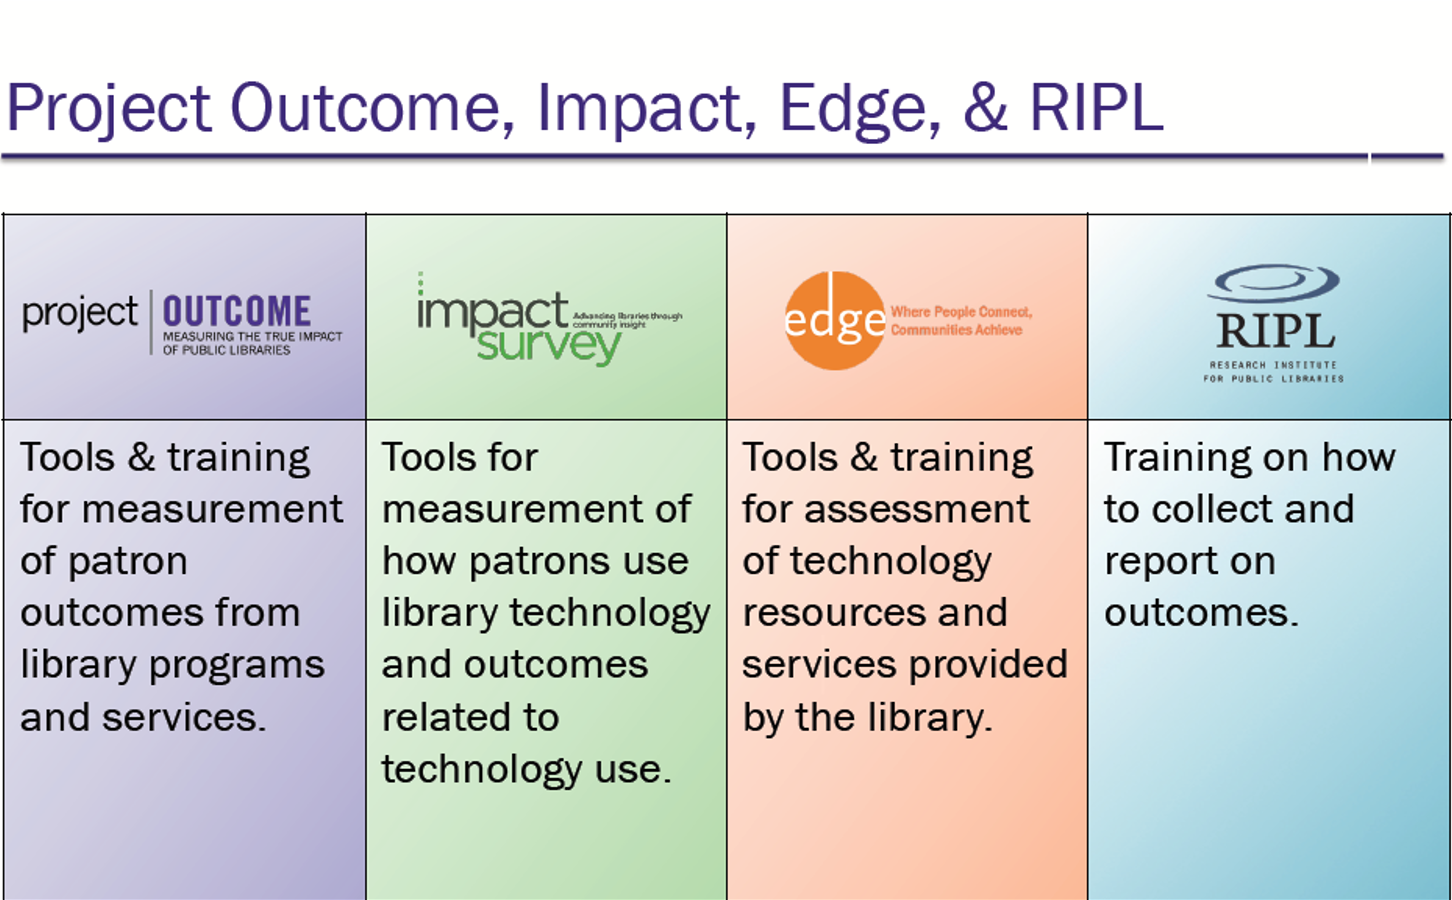
Impact Survey
EDGE
RIPL: Research Institute for Public Libraries
Communication
And this is the next step! Once you have your data and impact/outcome measurements done, you’re still not ready yet!
In future posting we’ll share ways to promote your data, use the free FOPL OpenMediaDesk services, create visualizations, and more.
It’s another talent beyond library statistical literacy to promote the library’s value, impact and worth.
Stephen Abram, MLS
executive director
FOPL